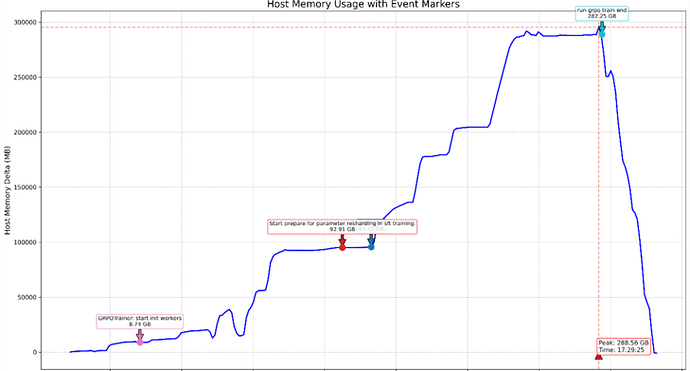
下述脚本启动命令为
./plot_host.sh run_qwen_grpo_vllm_test.sh
其中run_qwen_grpo_vllm_test.sh是要跑的脚本。该脚本通过统计host内存并实时打印,并不会写入到类似于output/msrun/worker_1.log中,因为该脚本并没有侵入修改代码。因此如果需要在日志中看到每秒的内存情况,需要将msrun的join设置为True,然后在启动脚本时添加> output.log 2>&1(将日志打印到该文件中),在该脚本结束后,会打印host峰值内存情况,并会保存下png文件。此外如果需要统计特定位置的host内存,可以在脚本中修改一下:
declare -a patterns=(
    "GRPOTrainer: start init workers"
    "Start prepare for parameter resharding in sft training."
    "Make experience begin at"
    "start vllm"
)
此处需要读取日志中打印的结果,因此需要在代码中加上日志打印,当一个文本多次出现,会获取host内存最大处的日志画图上。
   #!/bin/bash

# 获取初始内存值和总内存(单位MB)
base_mem=$(free -m | awk '/Mem:/ {print $3}')
total_mem=$(free -m | awk '/Mem:/ {print $2}')
start_timestamp=$(date +%s)

# 清空或创建输出文件
echo -n "" > memory.json
echo -n "" > markers.tmp  # 临时存储所有标记点

# 定义要捕获的日志模式数组
declare -a patterns=(
    "GRPOTrainer: start init workers"
    "Start prepare for parameter resharding in sft training."
    "start vllm"
    "run grpo train end"
)

# 创建命名管道用于捕获目标脚本输出
mkfifo /tmp/mem_monitor_fifo

# 启动目标脚本(后台运行),并重定向输出到命名管道
TARGET_SCRIPT=$1
echo "启动目标脚本: $TARGET_SCRIPT"
bash $TARGET_SCRIPT > /tmp/mem_monitor_fifo 2>&1 &
pid=$!

# 启动后台进程处理目标脚本输出
(
    while IFS= read -r line; do
        # 打印目标脚本的输出
        echo "$line"

        # 检查所有定义的模式
        for pattern in "${patterns[@]}"; do
            if [[ "$line" == *"$pattern"* ]]; then
                current_time=$(date +"%Y-%m-%dT%H:%M:%S.%3N%z")
                current_mem=$(free -m | awk '/Mem:/ {print $3}')
                mem_delta=$((current_mem - base_mem))

                # 记录标记点到临时文件
                marker_json="{\"timestamp\": \"${current_time}\", \"mem_delta_mb\": ${mem_delta}, \"log_line\": \"${line}\", \"pattern\": \"${pattern}\"}"
                echo "$marker_json" >> markers.tmp
                echo ">>> 检测到标记日志: [$pattern] (内存增量: ${mem_delta}MB)"

                # 找到匹配后跳出当前循环,避免一行匹配多个模式
                break
            fi
        done
    done
) < /tmp/mem_monitor_fifo &
log_pid=$!

# 监控循环
echo "开始监控内存使用情况..."
echo "监控的日志模式:"
for pattern in "${patterns[@]}"; do
    echo "  - \"$pattern\""
done

while true; do
    # 检查目标进程是否仍在运行
    if ! kill -0 $pid 2>/dev/null; then
        echo "检测到目标脚本已结束"
        break
    fi

    # 获取当前时间(ISO 8601格式)
    current_time=$(date +"%Y-%m-%dT%H:%M:%S.%3N%z")

    # 获取当前内存使用量
    current_mem=$(free -m | awk '/Mem:/ {print $3}')

    # 计算增量内存(当前内存 - 基准内存)
    mem_delta=$((current_mem - base_mem))

    # 计算当前内存占用百分比
    mem_percent=$(awk -v cur="$current_mem" -v tot="$total_mem" 'BEGIN { printf "%.2f", (cur/tot)*100 }')

    # 生成JSON记录
    json_record="{\"timestamp\": \"${current_time}\", \"mem_delta_mb\": ${mem_delta}}"

    # 追加写入JSON文件
    echo "$json_record" >> memory.json

    # 显示信息
    printf "[%s] Δ内存: %6d MB | 内存占用: %6s%%\n" "$current_time" $mem_delta "$mem_percent"

    sleep 1
done

# 清理后台进程
kill $log_pid 2>/dev/null
rm /tmp/mem_monitor_fifo

# 最终处理:将所有JSON对象包装成数组
echo "目标脚本已结束,准备生成JSON数组..."
echo "[" > memory_array.json
if [ -s memory.json ]; then
    sed '$!s/$/,/' memory.json >> memory_array.json
fi
echo "]" >> memory_array.json

# 处理标记点数据:每个模式只保留内存增量最大的记录
echo "处理标记点数据(每个模式保留最大值)..."
if [ -s markers.tmp ]; then
    # 使用Python处理标记点数据
    python3 - <<EOF
import json
from collections import defaultdict

# 读取临时文件
markers = []
with open('markers.tmp', 'r') as f:
    for line in f:
        if line.strip():  # 跳过空行
            try:
                marker = json.loads(line)
                markers.append(marker)
            except json.JSONDecodeError:
                print(f"跳过无效的JSON行: {line.strip()}")

# 按模式分组并找出每组最大值
pattern_max = defaultdict(dict)
for marker in markers:
    pattern = marker['pattern']
    mem_delta = marker['mem_delta_mb']

    # 如果该模式还没有记录,或者当前记录内存更大,则更新
    if pattern not in pattern_max or mem_delta > pattern_max[pattern]['mem_delta_mb']:
        pattern_max[pattern] = marker

# 转换为列表
result = list(pattern_max.values())

# 按内存值排序(从大到小)
result.sort(key=lambda x: x['mem_delta_mb'], reverse=True)

# 写入最终文件
with open('markers_array.json', 'w') as f:
    json.dump(result, f, indent=2)
EOF
else
    echo "[]" > markers_array.json
fi
rm -f markers.tmp

# 绘制内存变化图
echo "开始绘制内存变化图..."
python3 - <<EOF
import json
import matplotlib.pyplot as plt
from datetime import datetime
import matplotlib.dates as mdates
import os
import re
import numpy as np

# 检查数据文件是否存在
if not os.path.exists('memory_array.json') or os.path.getsize('memory_array.json') == 0:
    print("错误: 没有找到有效的内存数据")
    exit(1)

# 读取内存数据
try:
    with open('memory_array.json') as f:
        data = json.load(f)
except json.JSONDecodeError:
    print("错误: JSON文件格式不正确")
    exit(1)

# 读取标记点数据
markers = []
if os.path.exists('markers_array.json') and os.path.getsize('markers_array.json') > 0:
    try:
        with open('markers_array.json') as f:
            markers = json.load(f)
    except:
        print("警告: 无法解析标记点数据")

# 确保有足够的数据点
if len(data) == 0:
    print("警告: 没有记录到内存数据")
    exit(0)
elif len(data) == 1:
    data.append(data[0])

# 提取并转换时间数据
timestamps = [datetime.strptime(d['timestamp'], "%Y-%m-%dT%H:%M:%S.%f%z") for d in data]
mem_delta = [d['mem_delta_mb'] for d in data]

# 创建图表
plt.figure(figsize=(16, 10))
plt.plot(timestamps, mem_delta, 'b-', linewidth=2, label='Memory Usage')

# 添加标记点
if markers:
    marker_times = [datetime.strptime(m['timestamp'], "%Y-%m-%dT%H:%M:%S.%f%z") for m in markers]
    marker_values = [m['mem_delta_mb'] for m in markers]

    # 为不同模式创建颜色映射
    patterns = list(set([m['pattern'] for m in markers]))
    color_map = plt.cm.get_cmap('tab10', len(patterns))
    pattern_to_color = {pattern: color_map(i) for i, pattern in enumerate(patterns)}

    # 绘制标记点
    for i, marker in enumerate(markers):
        time = datetime.strptime(marker['timestamp'], "%Y-%m-%dT%H:%M:%S.%f%z")
        value = marker['mem_delta_mb']
        pattern = marker['pattern']
        color = pattern_to_color[pattern]

        # 计算内存使用量 (GB)
        mem_gb = value / 1024.0

        # 简化的标注文本:模式 + 内存使用量 (GB)
        annotation_text = f"{pattern}\n{mem_gb:.2f} GB"

        # 绘制点
        plt.scatter([time], [value], c=[color], s=100, zorder=5, label=f'{pattern}' if i == 0 else "")

        # 添加文本标注 - 只显示模式和内存量
        plt.annotate(annotation_text,
                     xy=(time, value),
                     xytext=(time, value + max(mem_delta)*0.05),
                     arrowprops=dict(facecolor=color, shrink=0.05),
                     fontsize=9,
                     bbox=dict(boxstyle="round,pad=0.3", fc="white", ec=color, alpha=0.8),
                     horizontalalignment='center')

# 添加标题和标签
plt.title('Host Memory Usage with Event Markers', fontsize=16)
plt.xlabel('Time', fontsize=12)
plt.ylabel('Host Memory Delta (MB)', fontsize=12)

# 设置时间轴格式
plt.gca().xaxis.set_major_formatter(mdates.DateFormatter('%m/%d %H:%M:%S'))
plt.gca().xaxis.set_major_locator(mdates.AutoDateLocator())
plt.gcf().autofmt_xdate()  # 自动旋转日期标签

# 添加网格和样式
plt.grid(True, linestyle='--', alpha=0.7)
plt.xticks(fontsize=10, rotation=45)
plt.yticks(fontsize=10)

# 添加峰值标记
if mem_delta:
    max_mem = max(mem_delta)
    max_men_gb = max_mem / 1024.0
    max_time = timestamps[mem_delta.index(max_mem)]
    plt.axhline(y=max_mem, color='r', linestyle='--', alpha=0.5)
    plt.axvline(x=max_time, color='r', linestyle='--', alpha=0.5)
    plt.annotate(f'Peak: {max_men_gb:.2f} GB\nTime: {max_time.strftime("%H:%M:%S")}',
                xy=(max_time, max_men_gb),
                xytext=(max_time, max_men_gb*0.9),
                arrowprops=dict(facecolor='red', shrink=0.05),
                fontsize=10,
                bbox=dict(boxstyle="round,pad=0.3", fc="white", ec="red", alpha=0.8))

# 保存和显示图表
plt.tight_layout()
output_file = 'memory_usage_realtime.png'
plt.savefig(output_file, dpi=300)
print(f"内存变化图已保存为: {output_file}")

if mem_delta:
    print(f"Host内存峰值为:{max_men_gb:.2f} GB")

# 显示标记点信息
if markers:
    print("\n检测到的日志标记点(每个模式的最大值):")
    for i, marker in enumerate(markers, 1):
        mem_gb = marker['mem_delta_mb'] / 1024.0
        print(f"{i}. 时间: {marker['timestamp']} | Δ内存: {marker['mem_delta_mb']} MB ({mem_gb:.2f} GB)")
        print(f"   模式: {marker['pattern']}")
EOF

echo "监控完成!结果文件:"
echo "  - 内存数据: memory_array.json"
echo "  - 标记点数据: markers_array.json (每个模式的最大值)"
echo "  - 内存图表: memory_usage_realtime.png"
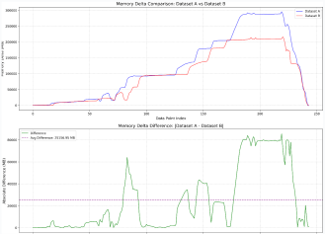
在每次结束后,都会保存memory_array.json文件,里面记录了每秒的内存情况,接下来可以通过一下脚本绘制2个host内存情况对齐,只需要修改json路径即可。
import matplotlib.pyplot as plt
import numpy as np


# 1. 加载JSON文件
def load_json(file_path):
    with open(file_path, 'r') as f:
        return json.load(f)


# 2. 处理数据差异(按位置比较)
def calculate_difference_by_position(data1, data2):
    """计算两个数据集在相同位置上的绝对差异"""
    # 确定共同的数据点数量
    n = min(len(data1), len(data2))

    # 计算差异
    diff = []
    for i in range(n):
        val1 = data1[i]['mem_delta_mb']
        val2 = data2[i]['mem_delta_mb']
        diff.append({
            'index': i,
            'difference': abs(val1 - val2)
        })

    return diff, n


# 3. 可视化函数
def plot_comparison(data1, data2, title1, title2):
    # 提取数据值
    values1 = [item['mem_delta_mb'] for item in data1]
    values2 = [item['mem_delta_mb'] for item in data2]

    # 创建索引作为X轴
    indices1 = list(range(len(data1)))
    indices2 = list(range(len(data2)))

    # 计算差异
    diff_data, common_count = calculate_difference_by_position(data1, data2)
    diff_indices = [item['index'] for item in diff_data]
    diff_values = [item['difference'] for item in diff_data]

    # 创建图表
    plt.figure(figsize=(15, 12))

    # 图表1:原始数据对比
    plt.subplot(2, 1, 1)
    plt.plot(indices1, values1, 'b-', label=title1, alpha=0.7, linewidth=1.5)
    plt.plot(indices2, values2, 'r-', label=title2, alpha=0.7, linewidth=1.5)

    plt.title(f'Memory Delta Comparison: {title1} vs {title2}', fontsize=14)
    plt.xlabel('Data Point Index', fontsize=12)
    plt.ylabel('Memory Delta (MB)', fontsize=12)
    plt.legend(fontsize=10)
    plt.grid(True, linestyle='--', alpha=0.6)

    # 添加垂直分隔线以区分数据集
    if len(data1) != len(data2):
        plt.axvline(x=common_count - 0.5, color='gray', linestyle='--', alpha=0.5)
        plt.text(common_count - 0.5, max(max(values1), max(values2)),
                 f"Common points: {common_count}",
                 ha='right', va='top', rotation=90, backgroundcolor='white')

    # 图表2:数据差异(按位置比较)
    plt.subplot(2, 1, 2)
    plt.plot(diff_indices, diff_values, 'g-', label='Difference', alpha=0.8, linewidth=1.5)

    # 添加平均差异线
    avg_diff = np.mean(diff_values) if diff_values else 0
    plt.axhline(y=avg_diff, color='purple', linestyle='--', alpha=0.7,
                label=f'Avg Difference: {avg_diff:.2f} MB')

    plt.title(f'Memory Delta Difference: |{title1} - {title2}|', fontsize=14)
    plt.xlabel('Data Point Index', fontsize=12)
    plt.ylabel('Absolute Difference (MB)', fontsize=12)
    plt.legend(fontsize=10)
    plt.grid(True, linestyle='--', alpha=0.6)

    # 添加统计信息
    stats_text = (f"Compared points: {common_count}\n"
                  f"Dataset sizes: {title1}={len(data1)}, {title2}={len(data2)}\n"
                  f"Max difference: {max(diff_values) if diff_values else 0:.2f} MB\n"
                  f"Avg difference: {avg_diff:.2f} MB")

    plt.figtext(0.5, 0.01, stats_text,
                ha="center", fontsize=10,
                bbox={"facecolor": "lightyellow", "alpha": 0.5, "pad": 5})

    plt.tight_layout(rect=[0, 0.03, 1, 0.97])  # 为底部文本留出空间
    plt.savefig('memory_comparison.png', dpi=300, bbox_inches='tight')
    plt.show()


# 4. 主执行流程
if __name__ == "__main__":
    # 替换为实际文件路径
    file1 = "/home/wyc/rl-new/ygd/memory_array.json"
    file2 = "/home/wyc/rl-new/ygd/memory.json"

    # 加载JSON数据
    data1 = load_json(file1)
    data2 = load_json(file2)

    # 可视化比较
    plot_comparison(data1, data2, "Dataset A", "Dataset B")
如果需要详细定位到是哪一行代码导致host侧异常,可以在该行代码前后添加一下代码
import psutil
import time
import sys

def get_memory_usage():
    mem = psutil.virtual_memory()
    used_gb = mem.used / (1024 ** 3)
    total_gb = mem.total / (1024 ** 3)
    percent = mem.percent
    return f"{used_gb:.1f}/{total_gb:.1f} GB ({percent}%)"

def main(interval=1):
    # 初始化CPU使用率计算
    psutil.cpu_percent(interval=0.1)

    try:
        while True:
            # 获取CPU使用率
            cpu_percent = psutil.cpu_percent(interval=interval)

            # 获取内存使用信息
            mem_info = get_memory_usage()

            # 实时输出
            sys.stdout.write(f"\rCPU使用率: {cpu_percent:5.1f}%  内存使用: {mem_info}")
            sys.stdout.flush()
            time.sleep(interval)

    except KeyboardInterrupt:
        print("\n监控已停止。")

if __name__ == "__main__":
    main()

